CSS Styling
Chart appearance is primarily controlled by using Java API.
Note | CSS styling is not the default, but can be enabled by setting styledMode to true. |
Caution | Both CSS and Java styling cannot be used in the same chart
While no error is thrown if different styling methods are used in the same chart, only one method should be used in any chart, since having both could lead to unexpected results.
|
Chart chart = new Chart();
Configuration conf = chart.getConfiguration();
conf.getChart().setStyledMode(true);
After enabling styledMode, the chart appearance is primarily controlled by CSS style rules.
A comprehensive list of the supported style classes can be found here.
Steps for styling a chart
Create a CSS file (by convention this should be at
frontend/styles/).Specify the desired CSS rules in the theme file.
If multiple charts are present, each one can be specifically targeted by the host selector e.g
:host(.first-chart-class).@CssImport(value = "./styles/my-charts-styles.css", themeFor = "vaadin-chart")== Example 1: Chart with Yellow Point Markers and Red Labels
custom-chart-styles.css
:host(.first-chart) g.highcharts-markers > .highcharts-point {
  fill: yellow;
}

:host(.first-chart) .highcharts-data-label text {
  fill: red;
}
Note |
If you want your CSS rules to only apply to charts with styledMode enabled, add an attribute selector like :host(.first-chart)[styledMode].
|
CssStyleExample.java
@CssImport(value = "./styles/custom-chart-styles.css", themeFor = "vaadin-chart")
public class CssStyleExample extends Div {

    public CssStyleExample() {
        Chart chart = new Chart();
        Configuration configuration = chart.getConfiguration();

        configuration.getChart().setType(ChartType.LINE);

        configuration.getxAxis().setCategories("Jan", "Feb", "Mar", "Apr");

        DataSeries ds = new DataSeries();
        ds.setData(7.0, 6.9, 9.5, 14.5);

        DataLabels callout = new DataLabels(true);
        callout.setShape(Shape.CALLOUT);
        callout.setY(-12);
        ds.get(1).setDataLabels(callout);
        ds.get(2).setDataLabels(callout);
        configuration.addSeries(ds);

        chart.addClassName("first-chart");
        add(chart);
    }
}
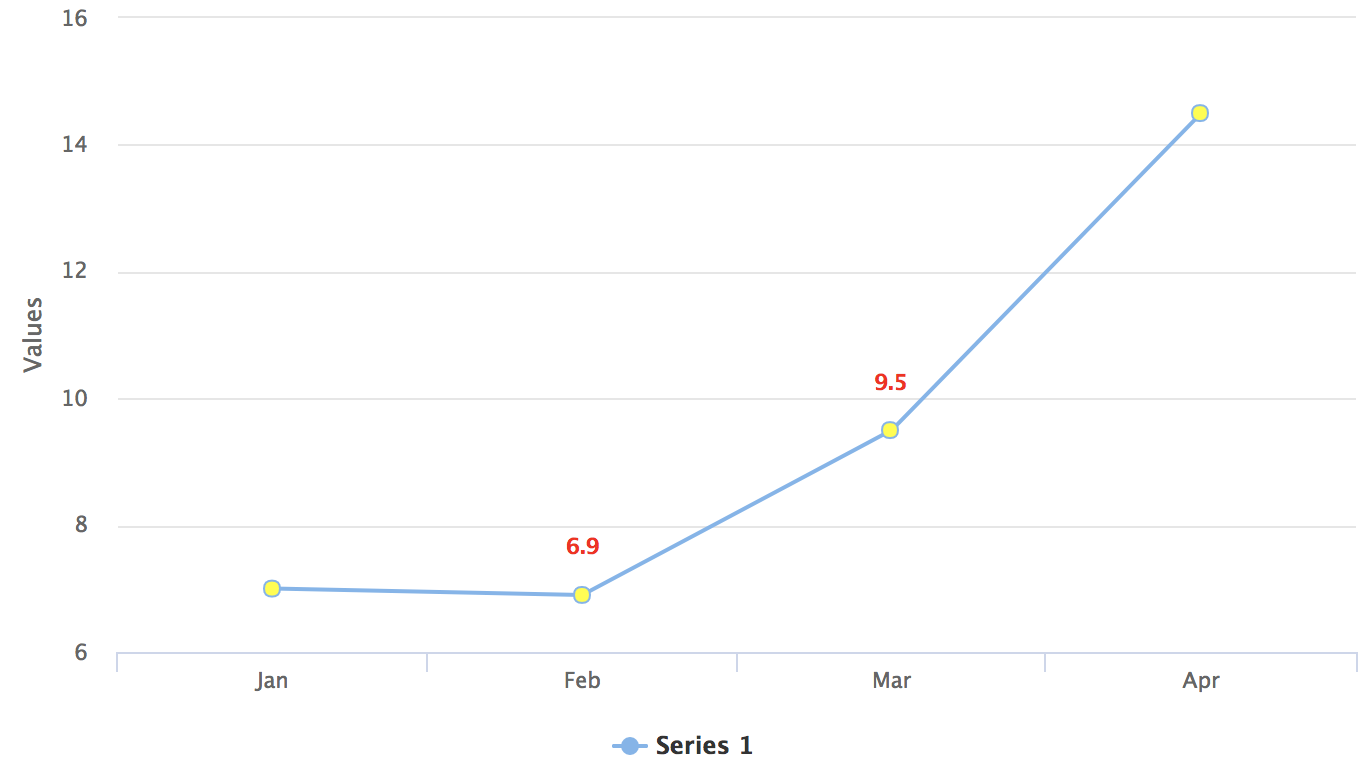
Chart with Yellow Point Markers and Red Labels
Example 2: Exposing a Chart element in Java for CSS Styling
huge-axis.css
.huge-axis {
  fill: red;
  font-size: xx-large;
}
CssStyleExample.java
@CssImport(value = "./styles/huge-axis.css", themeFor = "vaadin-chart")
public class CssStyleExample extends Div {

    public CssStyleExample() {
        Chart chart = new Chart();
        Configuration configuration = chart.getConfiguration();

        DataSeries ds = new DataSeries();
        ds.setData(7.0, 6.9, 9.5, 14.5);
        configuration.addSeries(ds);

        configuration.getxAxis().setCategories("Jan", "Feb", "Mar", "Apr");

        // Expose the X-Axis for CSS targeting.
        configuration.getxAxis().setClassName("huge-axis");

        add(chart);
    }
}
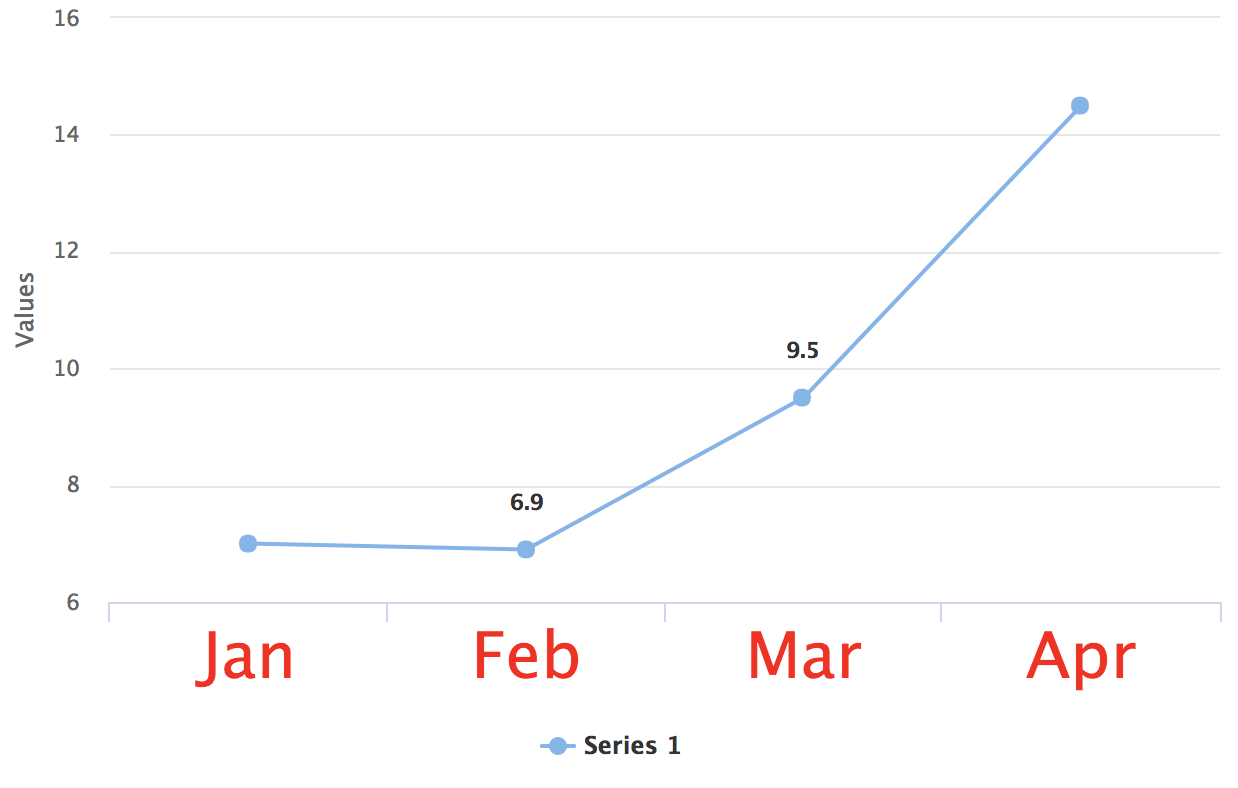
Chart with a Huge X-Axis